
Maintaining a Clear View: The Most Commonly Used Geospatial Datasets for Assessing Nature-based Solutions
In this blog post, we provide an overview of the most commonly used geospatial datasets for assessing nature-based solutions. For each category of analysis, we will highlight 1-2 datasets that you shouldn't miss! At the end, you can find a case study on how you can automate your data analysis on these datasets with Maya.
Content Overview:
- Land Use and Land Cover: Dynamic World & MapBiomas Brazil
- Forest Cover: Global Forest Change (Hansen)
- Mangrove Cover: Global Mangrove Watch
- Biomass: Above Ground Biomass Density
- Canopy Height: Global Forest Canopy Height
- Fire: MODIS & FIRMS
- Flood: JRC Yearly Water Classification History
- Drought: SPI & PDSI
- Additionality: SDPT
- Biodiversity: IBAT
- Case Study: Geospatial Datasets for Assessing Natural Assets on Maya
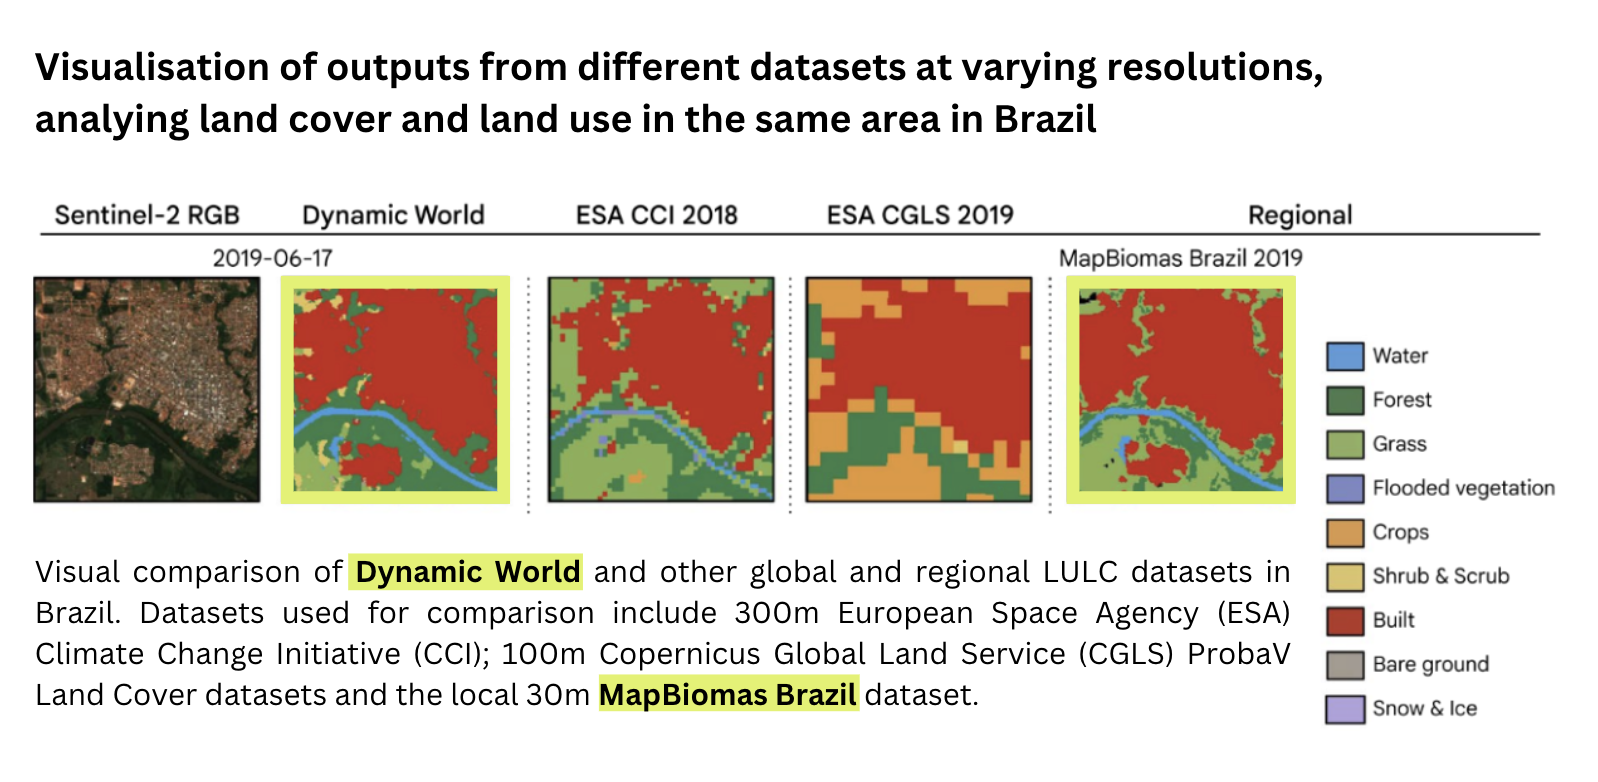
Land Use and Land Cover: Dynamic World & MapBiomas Brazil 🌎
In the world of land use and land cover (LULC) datasets, there is no “one-size-fits-all” option, as each dataset serves unique needs. Take, for example, Dynamic World by Google and the World Resources Institute, a global dataset that offers near real-time (updated every 2-5 days) land cover classification at a 10m resolution using a deep learning approach on Sentinel-2 satellite imagery. It is frequently updated, near real-time, and allows us to observe changes in land cover, such as deforestation, more quickly, offering valuable insights for assessing natural assets. This is a unique approach compared to most other LULC datasets, which only produce annual maps.
On the other hand, local datasets like MapBiomas Brazil are tailored to specific regions, in this case, Brazil. MapBiomas Brazil, a collaborative network formed by NGOs, universities, and technology startups, delivers annual land cover and land use change maps at a 30m resolution, utilising multiple satellite imagery sources from the Landsat series. Local maps benefit from the local expertise used in developing these maps, from not having ‘noise’ from other biomes and from being calibrated for their country or region specifically.
You can read more on satellite remote sensing in our previous blog post ‘Eyes in the Sky: A Beginner’s Guide to Satellite Remote Sensing (SRS) for Natural Assets’.
Forest Cover: Global Forest Change (Hansen)🌲
The Global Forest Change dataset, developed by Professor Matthew Hansen and his team at the University of Maryland, is a crucial tool for assessing forest cover globally. Leveraging data from the Landsat satellite series, this dataset provides insights into forest dynamics, offering annual updates on tree cover and forest loss. It can be used for tracking deforestation, forest degradation, and regrowth activities.
Global Forest Watch (GFW) provides an interactive online platform that utilises the Hansen Global Forest Change dataset as its primary source for detecting changes in tree cover globally. By making the data accessible to a broader audience, GFW enhances the dataset's utility. Additionally, GFW incorporates an analysis layer that includes a weekly deforestation alert system, allowing users to monitor forest changes more frequently.
While the GWF platform, utilising the Hansen dataset, is a highly valuable resource for monitoring global forest changes, it does face some criticisms and limitations. Some of them are:
- Resolution Limitations: The underlying Global Forest Change dataset is based on Landsat imagery with a 30m resolution, which might not capture very small-scale deforestation activities, such as selective logging or smaller clearings that can be crucial in certain contexts, like biodiversity conservation.
- Cloud Cover Issues: Satellite imagery, including that used by the Hansen dataset, can be significantly obstructed by cloud cover. This is a common issue in tropical regions where much of the world’s forests are located and where cloud cover can be persistent, potentially leading to gaps in data or delays in detecting changes.
- Underestimation of forest loss on smallholder land: Shimizu, Ota, and Mizoue (2020) found that ‘although the Global Forest Change map can partially detect disturbances even if they are less than 1 ha, the map should be cautiously used because of its high commission error in small-scale disturbances.’
You can read more about how different satellite imagery might be impacted by clouds in our previous blog post on satellite remote sensing.
Mangrove Cover: Global Mangrove Watch 🌊
The Global Mangrove Watch (GMW) dataset, launched as part of a collaboration among international organisations and research groups, aims to monitor mangrove forests globally. It utilises imagery primarily from the ALOS PALSAR satellites, operated by the Japan Aerospace Exploration Agency (JAXA). It leverages 25m resolution satellite imagery to detect mangrove deforestation, degradation, and regrowth. Bunting et al. (2022), the authors of the latest GMW model, found that the mangrove extent maps had an accuracy of about 87.4%. However, it is important to note that the GMW dataset is currently only updated through the year 2020. This is a significant limitation for those looking to assess the most current conditions of mangrove cover.
Biomass: Above Ground Biomass Density 🪴
To assess global biomass, the most commonly used dataset is the Global Ecosystem Dynamics Investigation (GEDI) Above Ground Biomass Density dataset by the United States Forest Service (USFS). During its 2-year mission aboard the International Space Station (ISS) from mid-2019 to mid-2021, it collected data at a 25m resolution. The GEDI mission, with its LiDAR measurements, is designed to increase our understanding and quantification of Earth’s biodiversity and carbon cycle by exploring ecosystem structure and dynamics in detail. The GEDI instrument gathered 3D data on the Earth’s surface across a global range from 52°N to 52°S latitudes, thus covering only a limited belt and not the entire Earth’s surface.
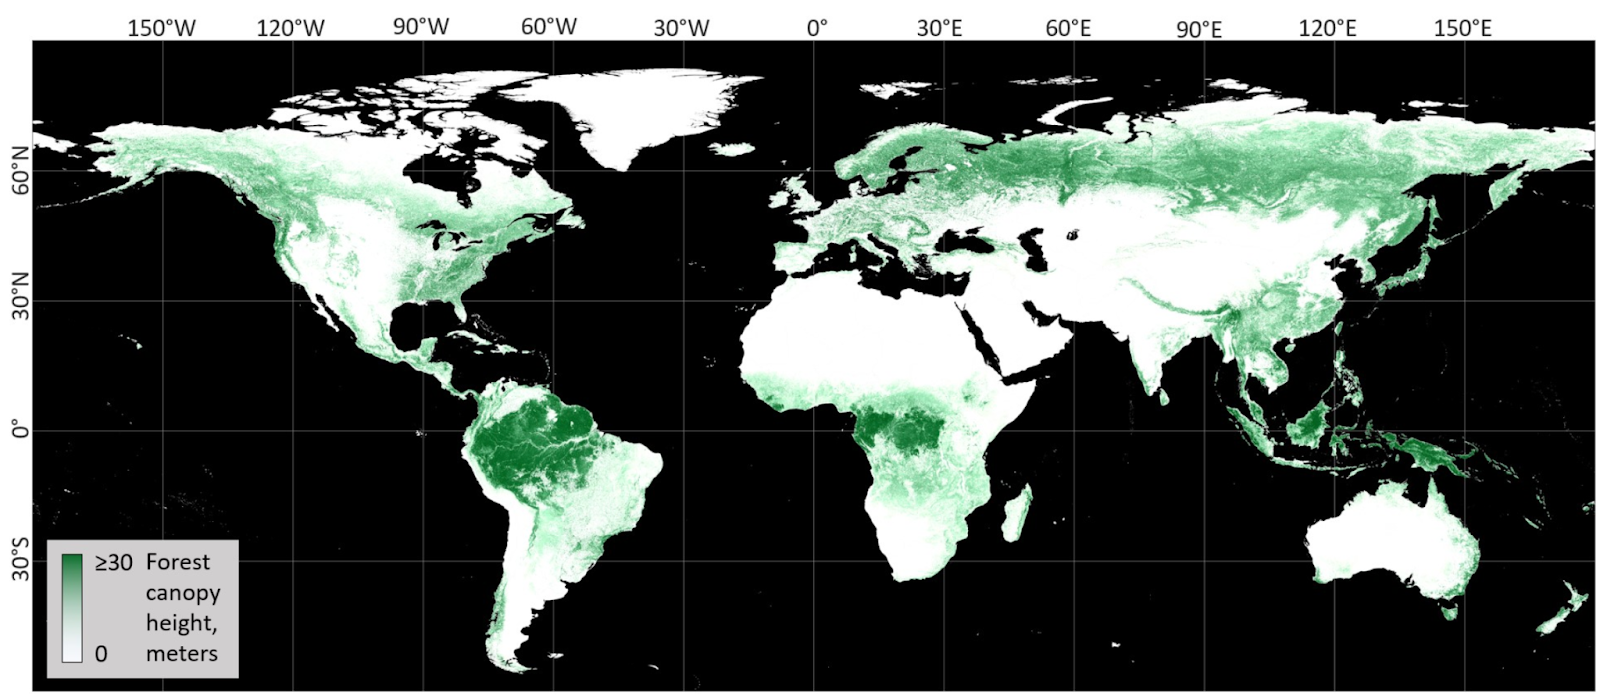
Canopy Height: Global Forest Canopy Height 📏
For their Global Forest Canopy Height dataset, the Global Land Analysis & Discovery (GLAD) working group from the University of Maryland has utilised GEDI data, which is also used for assessing biomass. However, GLAD goes one step further by combining the GEDI data with Landsat satellite imagery, thereby expanding the model to also cover boreal regions beyond GEDI’s limited geographical scope. Due to also utilising Landsat imagery, the spatial resolution of this dataset is 30m.
Fire: MODIS Burned Area & FIRMS 🔥
The most commonly used dataset for assessing fires is the MODIS Burned Area dataset from NASA and the United States Geological Survey (USGS), which utilises the Moderate-resolution Imaging Spectroradiometer (MODIS) instruments on the Terra and Aqua satellites. The dataset is regularly updated, with the most recent update in Google Earth Engine being from February 2024. The resolution is 500m for surface reflectance imagery and 1000m for active fire observations. The algorithm identifies the date of burn for each grid cell and comes with an estimated uncertainty as well. While commonly used, the relatively low resolution is often criticised.
For near-real-time active fire updates, the Fire Information for Resource Management System (FIRMS) by NASA offers two products using different satellite imagery sources. Global data is available within 3 hours of satellite observation, while U.S. and Canada active fire detections are available in real-time.
- The MODIS Active Fire Product utilises the aforementioned 1000m resolution satellite imagery to detect active fires.
- The VIIRS Active Fire Products originate from the Visible Infrared Imaging Radiometer Suite (VIIRS) aboard the Suomi National Polar-orbiting Partnership (NPP) satellite platform. They offer a higher resolution of 375m and improved nighttime performance compared to MODIS.
Utilising both sensors, FIRMS leverages the strengths of each system: MODIS provides continuity and extensive historical data critical for long-term studies, while VIIRS offers a higher resolution necessary for accurate and up-to-date fire detection and monitoring. Combining data from both sensors enhances the overall accuracy and effectiveness of FIRMS' fire monitoring capabilities.
Flood: JRC Yearly Water Classification History 💧
The JRC Yearly Water Classification History dataset, developed by the European Union’s Joint Research Centre (JRC), maps where and when surface water was present. The dataset utilises Landsat 5, 7, and 8 satellite imagery at a 30m resolution acquired between 1984 and 2021. Thus, while this is probably the most commonly used dataset for assessing historic flood risk, it is not available up to the present day.
Drought: SPI & PDSI 🏜️
The Standardised Precipitation Index (SPI) is widely regarded as the most commonly used indicator globally for detecting drought, using precipitation as a proxy. It captures how observed precipitation differs from previous averages over different time periods, ranging from 1 month to 3 years. The SPI is calculated by first fitting a long-term precipitation record for a desired period to a probability distribution, which is then transformed to a normal distribution, with a mean of zero. Thus, the SPI value shows the way in which the precipitation deviated from the mean. Negative values indicate a drier than usual period, while positive values a wetter than usual period. The SPI can be easily compared across different regions with different climates.
Another commonly used index for assessing drought is the Palmer Drought Severity Index (PDSI), which also takes temperature into consideration, in addition to precipitation. It estimates relative dryness and ranges from -10 (dry) to +10 (wet), with values below -3 representing a severe drought and below -4 an extreme drought. Compared to the SPI, it incorporates more variables, providing a more comprehensive assessment of drought conditions. However, its calculation is generally more complex and the results are not easily comparable between regions with markedly different climates. One dataset that already includes PDSI calculations is, e.g., the one from TerraClimate.
Note that both indices use ground-based meteorological data instead of satellite data.
Additionality: SDPT 🌱
A good initial proxy for assessing the additionality of a Nature-based Solutions project can be achieved by utilising the Spatial Database of Planted Trees (SDPT), created by Global Forest Watch. The data originates from country-specific maps created using various satellite imagery sources. The SDPT allows to differentiate between planted forests and tree crops (e.g,. oil palm plantations or apple orchards) from natural forests, enabling independent monitoring of changes in these planted areas distinct from changes in global natural forest cover. Several carbon credit rating companies utilise this database in their additionality assessments.
Biodiversity: IBAT 🐸
The Integrated Biodiversity Assessment Tool (IBAT) integrates several types of data to assess biodiversity:
- IUCN Red List of Threatened Species: Provides risk of extinction assessments for species globally.
- World Database on Protected Areas (WDPA): Contains the most comprehensive dataset on marine and terrestrial protected areas worldwide.
- Key Biodiversity Areas (KBA): Identifies areas of global significance for biodiversity conservation.
It is a joint project by BirdLife International, Conservation International, the International Union for Conservation of Nature (IUCN) and the UN Environment World Conservation Monitoring Centre (UNEP-WCMC). While IBAT primarily uses ground-sourced data from global conservation assessments and databases, it may incorporate satellite imagery indirectly through its coverage of protected areas and landscapes identified as critical for biodiversity. It is important to note that, unlike the previously mentioned datasets, IBAT’s data is private and available to subscribers only.
Case Study: Geospatial Datasets for Assessing Natural Assets on Maya 🐝
Maya is your geospatial co-pilot for assessing natural assets, leveraging the most commonly used publicly and commercially available geospatial datasets. When you assess your nature-based site on Maya, the analysis outputs come in the form of a time series map, a chart, and clear text commentary, offering you insights at a glance.
Below you can find a selection of datasets available on Maya and exemplary analysis outputs. Please note that a different site has been analysed in the Mangrove Cover job.
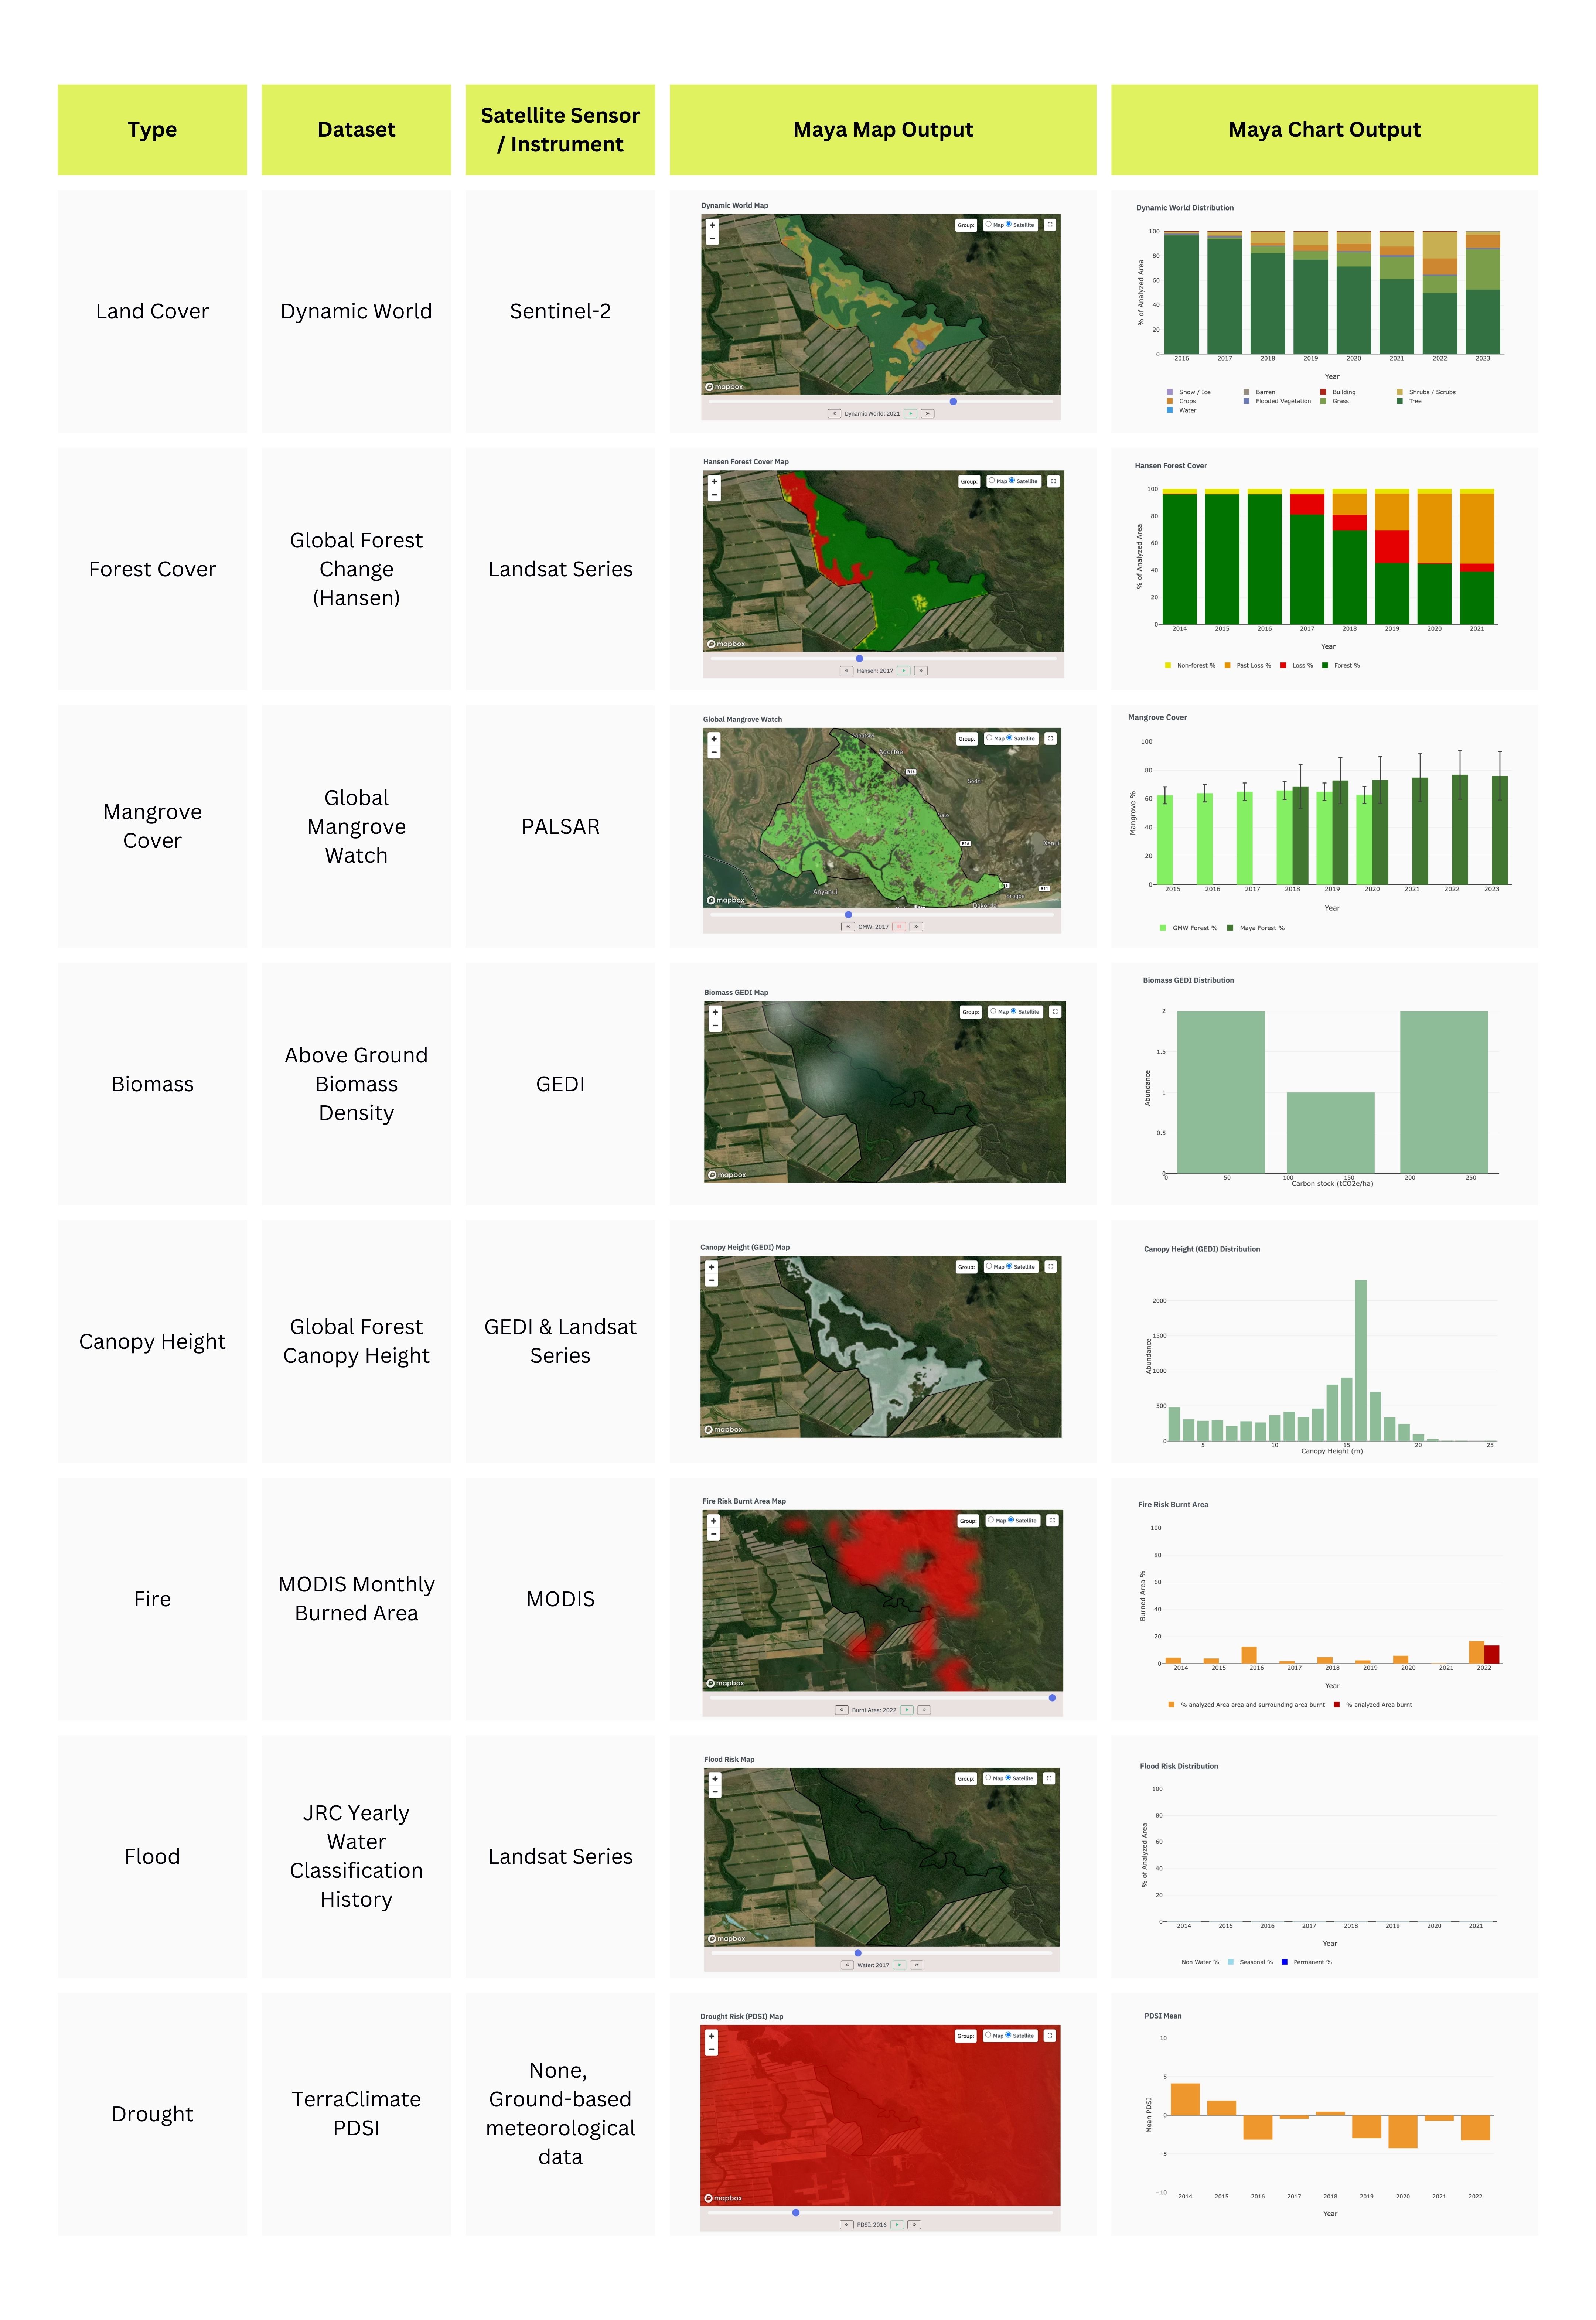
You can find Maya's full Analysis Catalog here.💡
If you want to learn more about how you can automate your data analysis on these datasets with Maya, book a free first consultation with our co-founder, Till, here.
Written by Delphine-Marie Zacharias 🧡
.png)